






A sand-washing plant drinks water — one to two cubic metres for every tonne of sand it cleans. Where that water is scarce, metered or hard to discharge, the economics of recovering it become as important as the sand quality itself. The arithmetic is simple, and it usually points the same way: recovery pays, often within a couple of years.
This article sets out the water balance, works the make-up water a plant actually consumes at different recovery rates, and runs a payback on a recovery system so the decision rests on numbers rather than instinct.
The water balance
Of the water a plant circulates, a fraction is recovered (by thickener, cyclone or filter press) and reused; the rest leaves with the product, the tailings and by evaporation, and must be replaced as fresh make-up water:

where  is the water circulated per tonne and
  the recovery fraction. Everything in the business case flows from this one relation.
| Symbol | Meaning | Units |
|---|---|---|
| Wused | Water circulated per tonne | m3 / t |
| r | Recovery fraction | 0 – 1 |
| Wmakeup | Fresh water required | m3 / t |
Worked example 1 — make-up water
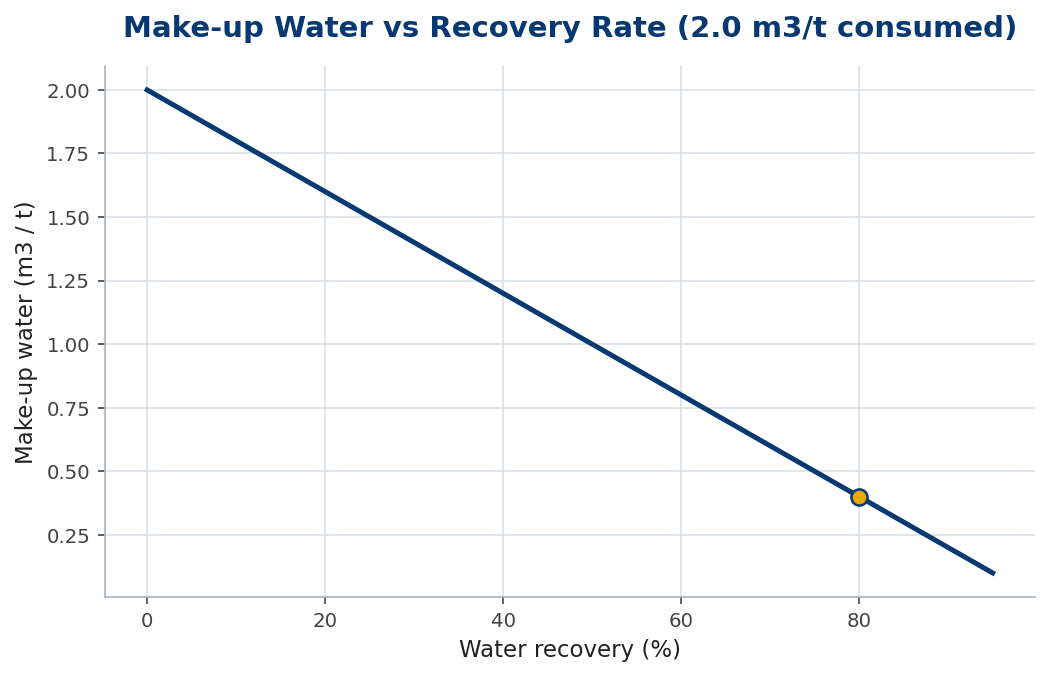
A plant circulates  and recovers 80% of it:

Recovery cuts fresh-water draw five-fold, from 2.0 to 0.4 m per tonne. Figure 1 shows how make-up water falls as recovery rises.
From cubic metres to rupees
Multiply the saved water by its true cost — tariff, pumping energy, and any discharge or treatment charge avoided. A plant doing 150 t/h for 4,000 hours a year cleans 600,000 t/yr. Going from no recovery to 80% saves  a year. Even at a modest delivered cost, that is a large recurring number — and it is what pays back the recovery plant.
Worked example 2 — the payback
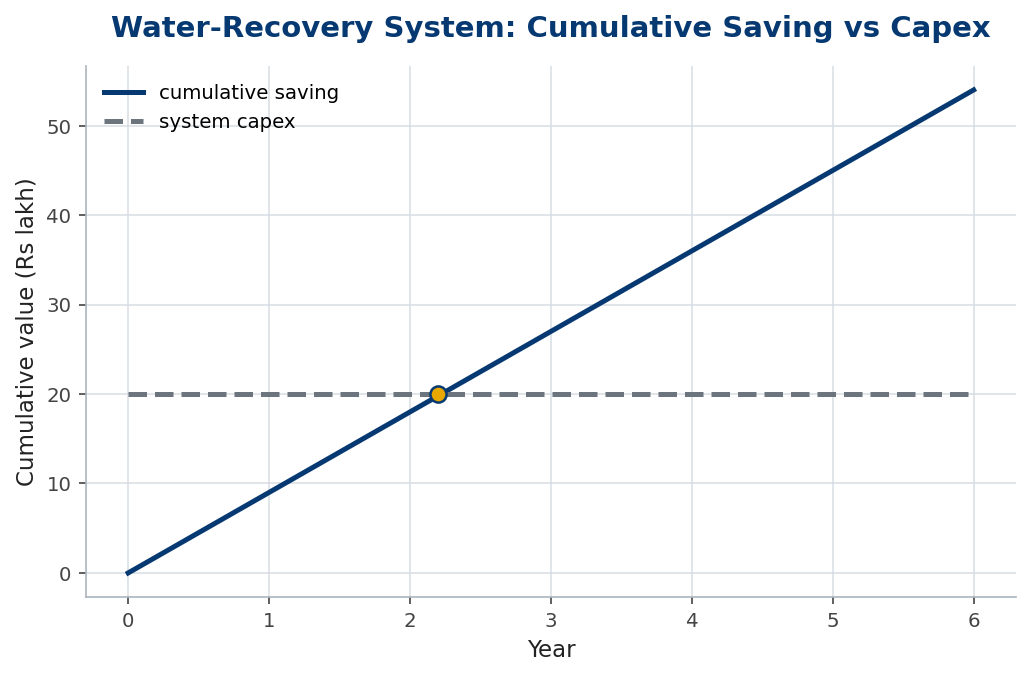
Say the recovery system (thickener, pumps, flocculant dosing) costs Rs 20 lakh installed and saves Rs 9 lakh a year in water, pumping and discharge. Simple payback is  ; after that it is pure saving, plus the harder-to-price benefits of resilience to water restrictions and a smaller discharge footprint. Where water is scarce or regulated, the payback is often far shorter.
In practice
Recovery is rarely free of running cost: flocculant, thickener power and sludge handling are real, so the honest number is the net saving, not the gross water value. Recovered water also carries fines and dissolved load, and beyond a point that affects wash quality — so a bleed of fresh water and a tailings outlet are part of the design, which is why 100% recovery is neither achievable nor desirable. Size the thickener to the solids load, not just the water, and the system delivers the saving the spreadsheet promised.
Common mistakes
- Costing gross, not net. Subtract flocculant, power and sludge handling before claiming the saving.
- Chasing 100% recovery. A fresh-water bleed protects wash quality; total recycle concentrates fines and slimes.
- Undersizing the thickener. Size to the solids settling load, or carryover ruins both water clarity and product.
The other half of the balance: sludge and its disposal
Recovering water is only half the loop; what the water leaves behind — the silt and clay it carried — has to go somewhere, and the cost and footprint of managing that sludge are part of the true economics. A wash plant does not destroy the fines it removes; it concentrates them, and concentrated fines are a stream to be handled, not a problem that has disappeared.
The traditional route is settling ponds: the dirty water sits in lagoons, the solids settle, and clarified water is drawn back. Ponds are cheap to build but hungry for land, need periodic and messy desilting, and tie up water and area indefinitely — a hidden cost that grows as the plant ages and the ponds fill. The land and the desilting, not the pumps, are often the real expense.
The engineered route replaces ponds with a thickener and a dewatering step — a filter press or centrifuge — that turns the sludge into a stackable, handleable cake and returns clarified water immediately. The capital is higher, but the land take collapses, water recovery is faster and more complete, and the dry cake can sometimes be sold or used rather than stored. The choice between ponds and a thickener-plus-press circuit is the central capital decision in a wash plant’s water economics.
So size the water balance for both directions: the make-up water saved by recycling, and the cost of concentrating and disposing of the fines that recycling strips out. A plant that counts only the water saved and ignores the growing pond, the desilting and the land is reading half the ledger — the sludge half is where many wash-plant economics quietly come undone.
The bottom line
Water recovery turns a recurring operating cost into a one-off capital one, and the make-up relation  makes the saving easy to size. For most wash plants the payback lands inside three years, and shorter still where water is metered or discharge is restricted.
Cost it on the net saving, leave a fresh-water bleed, and size the thickener to the solids — and recovery becomes one of the surest investments on the plant.
Frequently asked questions
How much water does sand washing use?
Commonly 1–2 m3 circulated per tonne of sand, depending on the clay and silt load and the wash equipment.
What recovery rate is realistic?
70–90% with a thickener and cyclones is typical; a fresh-water bleed keeps the last fraction from concentrating fines.
What drives the payback fastest?
Scarce or expensive water and any avoided discharge/treatment charge. Where water is cheap and discharge is free, payback lengthens.
Key takeaways
- Make-up water — recovery cuts fresh draw in proportion.
- 80% recovery turns 2.0 m3/t into 0.4 m3/t, a five-fold cut.
- Cost the net saving (after flocculant, power, sludge); payback is often under three years.
- Leave a fresh-water bleed and size the thickener to the solids load — 100% recovery is neither possible nor wise.
