


Ask what a tonne of crushed stone costs to make and most operators quote the electricity bill. Energy matters — but it is usually a minority of the true cost per tonne, and the single biggest lever on all of it is something free: running the plant near its capacity.
This article separates the two ideas that get muddled here: specific energy (a clean, measurable kWh/t) and cost per tonne (a stack of energy, wear, labour, maintenance and capital). Once the stack is in front of you the priorities usually invert — the bill you stare at every month is rarely the one worth cutting first.
Specific energy
Specific energy is simply power drawn per tonne produced:

Worked example 1
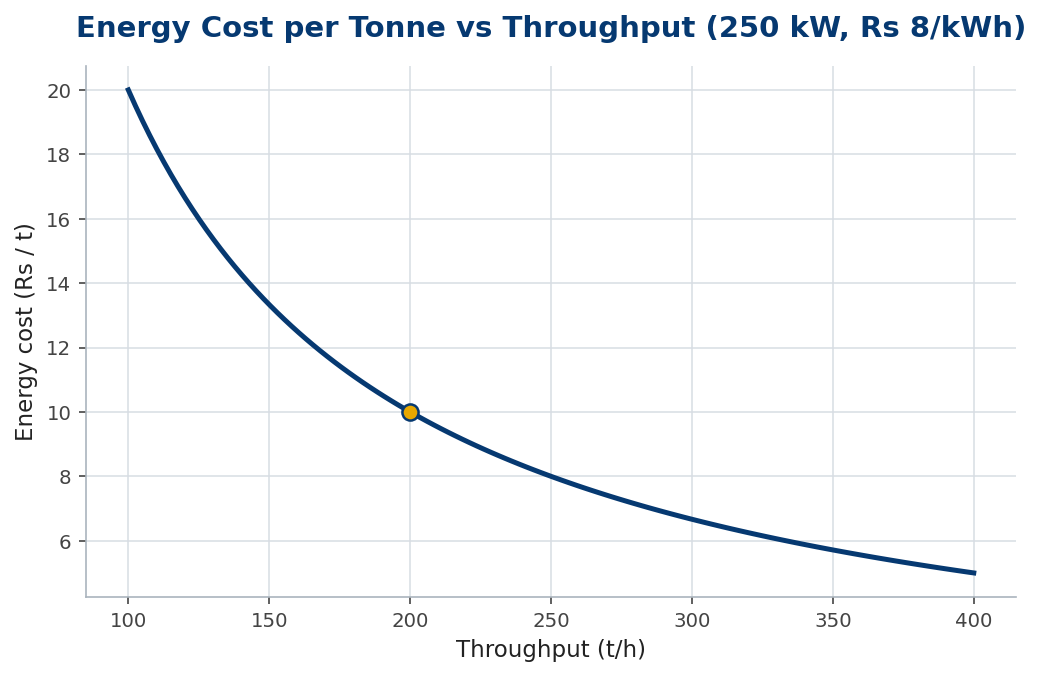
A crusher drawing 250 kW at 200 t/h has  . At a tariff of
  , that is
  per tonne in energy — real, but as we will see, under a quarter of the total.
Throughput is the master variable
Because power is largely fixed by the machine, energy cost per tonne falls as a hyperbola with throughput — idling at half capacity doubles the energy cost of every tonne, and the same logic hits every fixed cost in the plant.
The full cost stack
Energy is only one slice. Wear parts (liners, jaws, screen media) often exceed it, and labour, maintenance and amortised capital complete the picture:
Worked example 2 — the utilisation penalty
Suppose fixed costs (capex amortisation, salaried labour, base maintenance) total Rs 4,000 per operating hour. At 200 t/h that is Rs 20/t; at 120 t/h (60% utilisation) it balloons to Rs 33/t — a Rs 13/t penalty that dwarfs any plausible energy saving. The cheapest lever in the plant is keeping the feed steady and the machine full.
Building the stack for a real plant
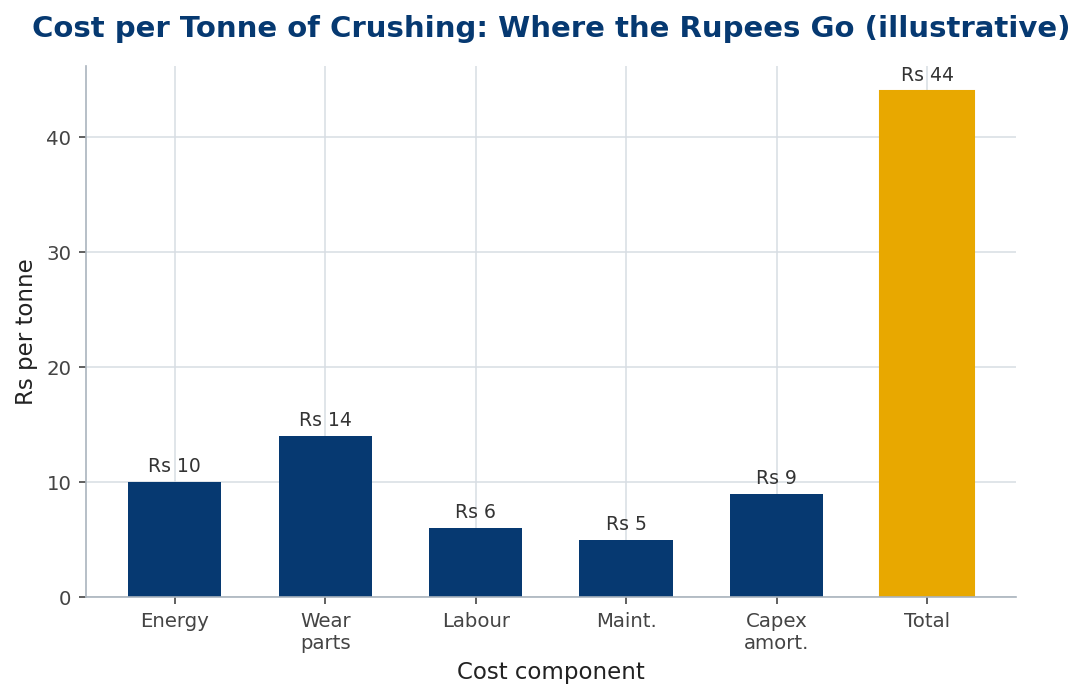
Put numbers to all of it for a 200 t/h granite plant. Energy we already have at Rs 10/t. Liners and jaw plates, from consumption records, run Rs 14/t. Operating labour spread over the tonnage is Rs 6/t, routine maintenance Rs 5/t, and amortised capital Rs 9/t. The cash cost to make a tonne is:
| Component | Rs / t | Share |
|---|---|---|
| Energy | 10 | 23% |
| Wear parts | 14 | 32% |
| Labour | 6 | 14% |
| Maintenance | 5 | 11% |
| Capex amortisation | 9 | 20% |
| Total | 44 | 100% |
The lesson is in the shares. Energy is under a quarter of the total, while wear is the single largest slice. A liner alloy or a setting change that lifts wear life by 20% saves Rs 2.8/t — more than you would gain by wiping out a tenth of the entire energy bill. Measure your own shares before deciding where to push.
In practice
The fastest way to cut cost per tonne is to measure your own stack rather than copy a textbook one. Meter the crusher and the whole plant separately so you know the true specific energy; weigh wear-part consumption against the tonnes between changes to get a real Rs/t for metal; and log operating hours against tonnes to expose your true utilisation. Most plants discover two things when they do this: wear is bigger than they assumed, and an hour of steady feeding is worth more than any tariff negotiation. Fix the feed and the utilisation first, then attack the single largest bar on the stack.
Common mistakes
- Optimising energy alone. Wear is often the larger cost; measure before you chase.
- Running below capacity. Every fixed cost per tonne rises as throughput falls.
- Ignoring demand charges. Peak-demand and power-factor penalties can rival the energy charge itself.
Frequently asked questions
What is a typical specific energy for crushing?
Whole-plant crushing of hard rock commonly runs ~1–3 kWh/t across the stages; a single secondary cone is often well under 1 kWh/t.
How do I cut cost per tonne fastest?
Keep the plant full. Utilisation dilutes every fixed cost; only then chase the largest variable cost, usually wear.
What share of cost is energy?
Often 15–30% of the cash cost per tonne — meaningful, but rarely the dominant slice.
Connected power, drawn power and the demand charge
The energy cost in the stack is not simply the electricity the crushers turn into broken rock. An industrial electricity bill has two parts: an energy charge for the kilowatt-hours consumed, and a demand charge for the peak kilowatts (or kVA) drawn, billed on the highest demand in the period regardless of how briefly it occurred. A plant that ignores the second can be blindsided by it.
Demand charges reward steady running and punish spikes. Starting large motors direct-on-line, or letting several heavy drives surge together, drives up the billed peak even though the energy consumed barely moves. Staggered starts, soft starters or variable-frequency drives, and simply avoiding simultaneous heavy starts can shave the demand charge appreciably — a cost saving that never shows up in the specific-energy figure.
Power factor is the other hidden lever. Induction motors draw reactive power that does no useful work but loads the supply, and a poor power factor attracts penalties or inflates the kVA demand. Power-factor correction — capacitor banks sized to the load — lifts the factor toward unity, cutting the penalty and freeing supply capacity, often with a payback measured in months.
So the honest cost of energy spans three things: the kilowatt-hours (specific energy times tonnage), the peak demand, and the power factor. The specific-energy calculation captures only the first; a plant serious about its cost per tonne reads the whole tariff, manages its starts and peaks, and corrects its power factor — turning the electricity bill from a fixed fact into a managed cost.
The bottom line
Specific energy is easy to measure and easy to over-weight. It is real money, but in a typical plant it is the minority of the cost to make a tonne — wear usually leads, and idle capacity quietly inflates every fixed cost. The operators who win on cost are the ones who built their own stack and acted on its largest bar.
Keep the plant full, size the bars, then attack the biggest. In most plants that is a wear-life improvement, not an energy tariff — and it is found by measuring, not assuming.
Key takeaways
 ; energy cost/t =
  tariff.
- Energy is usually a minority of cost per tonne — wear often leads.
- Throughput is the master lever: low utilisation inflates every fixed cost.
- Size the cost bars before optimising; attack the largest, not the most visible.