






A rotating machine talks before it breaks, and vibration is its voice. A bearing starting to spall, a coupling slipping out of line, a screen building a crack — each writes a signature into the vibration long before it announces itself with heat, noise or failure. Learning to read that signature is the foundation of condition-based maintenance.
This article introduces vibration analysis for crushing and screening plant: how severity is judged against ISO standards, and how the frequency spectrum tells unbalance from misalignment from a failing bearing.
Two questions: how much, and why
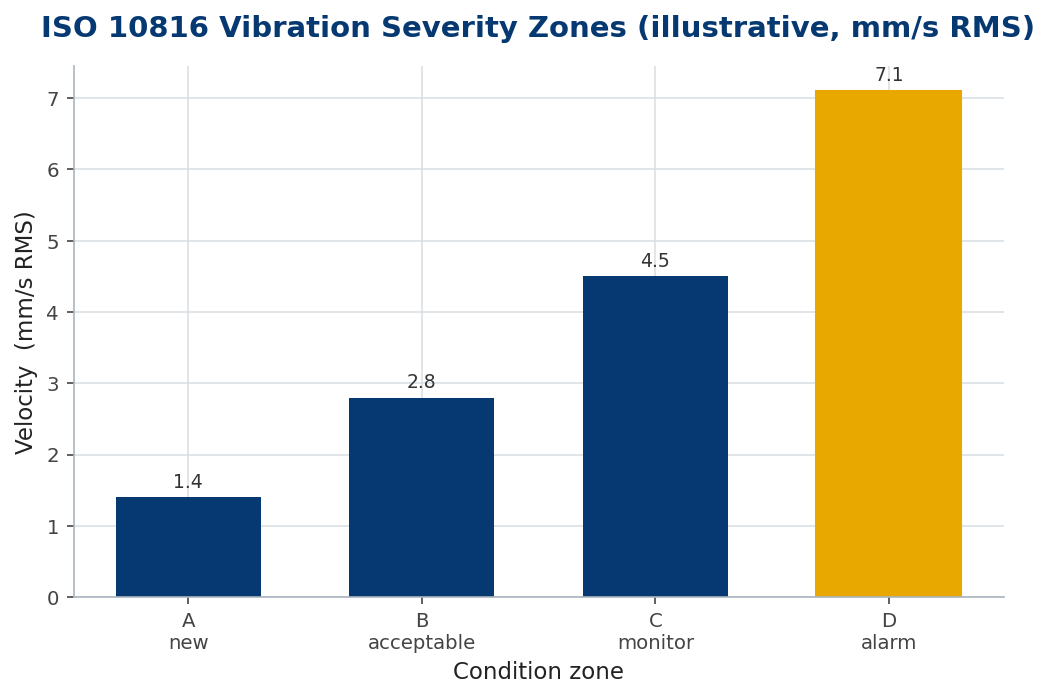
Vibration analysis answers two questions. First, how severe is it? Overall vibration velocity, in mm/s RMS, is compared against severity zones such as those in ISO 10816/20816 — new, acceptable, monitor, alarm. Second, why? The frequency spectrum decomposes the vibration into its components, and each fault lives at a characteristic frequency tied to the running speed.
The spectrum names the fault
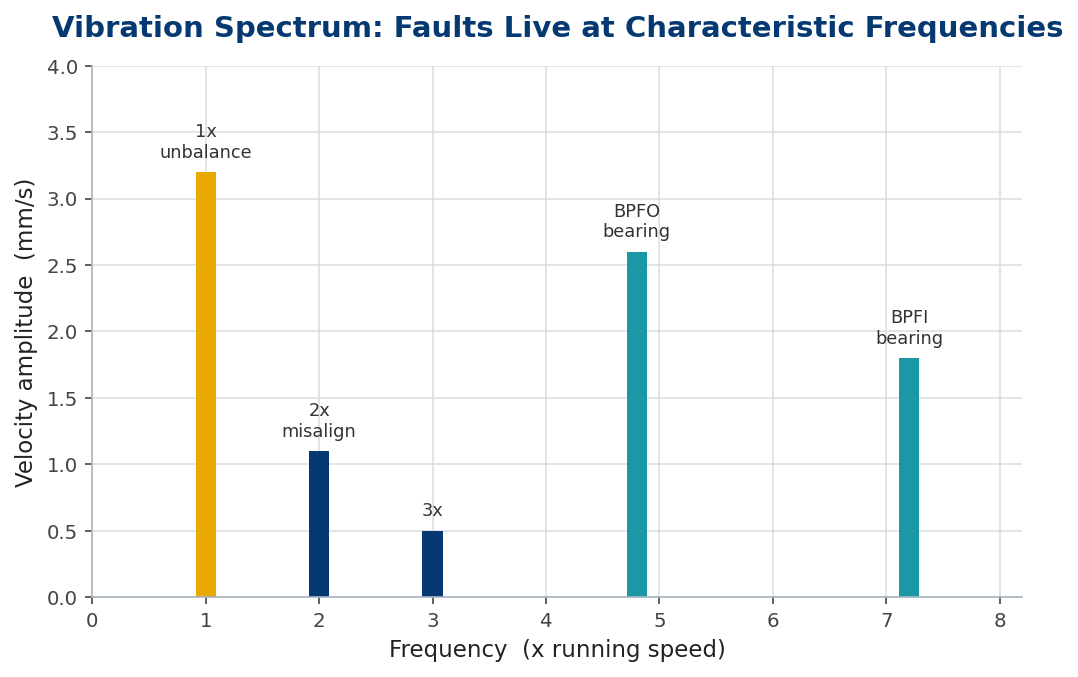
The power of vibration analysis is diagnostic. Plot amplitude against frequency (in multiples of running speed) and the peaks point straight at the cause: unbalance shouts at 1× running speed, misalignment at 2×, looseness throws a series of harmonics, and a defective bearing rings at its own calculated frequencies (BPFO, BPFI) that are non-integer multiples of speed.
Worked example 1 — reading a peak
A screen exciter runs at 900 rpm, i.e. 15 Hz. The analyst sees a strong peak at 30 Hz — exactly 2× running speed — with a smaller one at 15 Hz. The 2× dominance points to misalignment between the two exciter shafts, not unbalance. The fix is a coupling alignment, not a balance weight. The frequency told the analyst which repair before anyone opened the guard.
Worked example 2 — catching a bearing early
A bearing’s outer-race defect frequency (BPFO) is computed from its geometry — say 4.8× running speed. Long before the overall velocity reaches the alarm zone, the spectrum grows a small, sharp peak at 4.8×, often flanked by sidebands. Trended week to week, that peak climbs predictably, giving weeks of warning to order the bearing and schedule the change — turning a catastrophic seizure into a planned two-hour job. This early warning is the whole economic case for vibration monitoring.
| Fault | Frequency | Typical fix |
|---|---|---|
| Unbalance | 1x running speed | balance the rotor |
| Misalignment | 2x (and axial) | align coupling |
| Looseness | harmonics of 1x | tighten / re-shim |
| Bearing defect | BPFO / BPFI (non-integer) | replace bearing |
| Bent shaft | 1x with axial phase | straighten / replace |
In practice
Measure the same points, the same way, on a schedule — trends matter more than absolute numbers, and a rising trend is the alarm even within the ‘acceptable’ zone. Take readings in three directions (horizontal, vertical, axial); axial vibration is the tell for misalignment and bent shafts. Know your machines’ bearing defect frequencies in advance so a peak is instantly named. And close the loop: after a repair, re-measure to confirm the signature is gone, not merely masked.
Common mistakes
- Judging on one reading. Vibration analysis is about trends; a rising line warns before any threshold is crossed.
- Overall level only. Severity says that something is wrong; only the spectrum says what.
- Skipping the axial direction. Misalignment and bent shafts show up axially — horizontal-only readings miss them.
Resonance and phase: when the structure, not the bearing, is the fault
Not every high vibration is a worn part. Sometimes the machine is being driven at or near a natural frequency of its own structure or supports — resonance — and a modest forcing produces a violent response. A screen whose support steel has a natural frequency close to its operating speed will shake far harder than its exciters alone could explain, and no amount of balancing or bearing replacement will calm it, because the parts are healthy.
Resonance is why two diagnostic tools beyond the spectrum matter. A bump (impact) test — striking the stationary structure and reading its ring-down — reveals the natural frequencies, so you can check whether any sits near a running speed or its harmonics. And a run-up/coast-down measurement, watching how vibration changes as the machine passes through speeds, exposes resonant peaks as the speed sweeps across a natural frequency.
Phase analysis adds the other half of the diagnosis. Two points vibrating at the same frequency can move in step or in opposition, and that relative phase distinguishes faults a single amplitude cannot: pure unbalance moves a bearing pair in phase, a bent shaft or a structural twist moves them out of phase, and a soft-foot or cracked base shows a tell-tale phase shift across the joint. Amplitude says how much; phase often says which of two faults that share a frequency is really present.
The practical upshot: when a machine vibrates hard but the bearings and balance check out, suspect resonance or a structural fault before condemning more parts. A bump test, a coast-down and a phase reading cost minutes and routinely save a fruitless round of component changes on a problem that lives in the steelwork, not the rotor.
The bottom line
Vibration analysis answers how severe (overall velocity against ISO zones) and why (the frequency spectrum). Unbalance at 1×, misalignment at 2×, bearings at their own defect frequencies — the spectrum names the repair.
Trend the same points on a schedule, read all three directions, and know your bearing frequencies — and a seizure that would have stopped the plant becomes a bearing ordered weeks ahead and changed on a planned shift.
Frequently asked questions
What does vibration at 2x running speed mean?
Usually misalignment, often with raised axial vibration. Unbalance dominates at 1x; looseness throws multiple harmonics.
How early can vibration analysis catch a bearing fault?
Often weeks to months — a small peak at the bearing's defect frequency appears and grows long before overall severity reaches alarm.
Which standard sets vibration limits?
ISO 10816 / 20816 defines severity zones in mm/s RMS by machine class; use it as a guide and trend against your own baselines.
Key takeaways
- Severity (overall mm/s vs ISO zones) says how bad; the spectrum says why.
- 1x = unbalance, 2x = misalignment, harmonics = looseness, defect frequencies = bearings.
- Trend the same points on a schedule and read horizontal, vertical and axial.
- Bearing faults give weeks of warning — the core economic case for monitoring.
